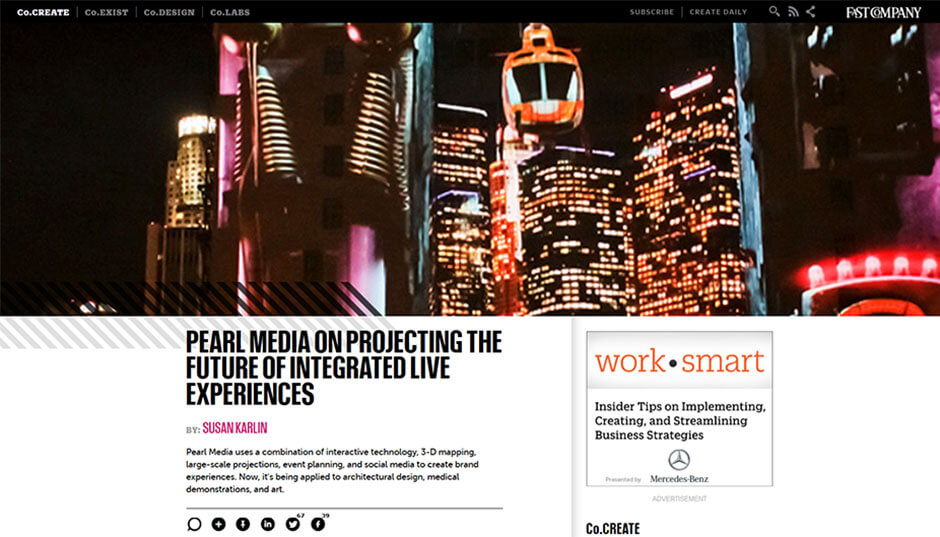
3D Projection Mapping is an increasingly attractive medium due to its unique format and disruptive visualization. However, like any other communications medium it must be measurable as an effective consumer marketing channel. Therefore, we will share our approach to establishing success metrics for 3D Projection Mapping events.
One of our recent blogs focused on creating viral contagion through various outlets such as social and earned media, which are directly linked to 3D projection metrics.
Social Media
There are two streams for distributing social media content as part our measurement process: consumer generated and brand generated content. Consumer generated content refers to on-site 3D projection visuals and event elements captured by the consumer via photo or video and shared with their social media following. Brand generated content is post production photo and video that is shared with the brand’s social media following.
Without giving away our complete proprietary system, we establish statistical benchmarks. The ability to monitor implemented hash tags is a powerful tool yet there is still a significant statistic of social media shares that do not utilize promoted hash tags. We have quantified that for every consumer who uploads consumer generated content not utilizing a promoted hash tag, a predetermined amount of consumers will see the post and a specific percentage of them will then share that content on their own social media page. While we’d like to assume that the content will be infinitely shared from one set of social media followers to the next, it is not a reasonable approach. Instead, we’ve proven that the amount of shares the content receives has a threshold with each subsequent viral share and spread.
Brand generated content is calculated similarly. The post production photo and video will be distributed, exclusively, from the official brand social media pages. Again, we have established that a predetermined percentage of the brand’s social media following will see the content posts. Of these viewers, our formula proves that a fixed percentage of the viewing consumers are brand evangelists. These evangelists will create the tipping point and share the brand generated content with their social media friends and followers, hence catalyzing the exponential domino effect.
Social Media ROI Factors to Consider:
-
Monitor promoted hash tag usage
-
Estimating posts not utilizing hash tags
-
Estimating total impressions made from brand pages
-
Total estimated shares
Earned Media
Historically, the most significant driver in generating ROI for 3D Projection Mapping events is earned media. Working in strategic tandem with your public relations team, a 3D Projection Mapping event can achieve over two million consumer impressions within days of the event when planned and targeted aggressively. For example, a CPG brand has relevance to consumer, business and trade media. A strategic earned media plan can then incorporate elements that generate interest among all three, including national/regional incentives, celebrity spokesperson and discreet bloggers. Unlike social media metrics, earned media is calculated by taking each respective media’s ratings, circulation and/or clicks to arrive at fair share value.
Earned Media ROI Factors to Consider:
-
Develop the earned media plan around the brand offerings
-
Determine strategic consumer, business and trade media targets
-
Calculate effectiveness based on each respective media’s circulation and/or clicks
What we have just reviewed is an overview of our methodology. We consistently find that, especially on a CPM basis, 3D Projection Mapping should be an ROI-rich medium.

